
Metal container trade statistics for HS 7310: who exports and imports steel cans under 50 litres, how the trade moved from 2020 to 2024, and where six markets buy them, from UN Comtrade data pulled on 21 October 2026.
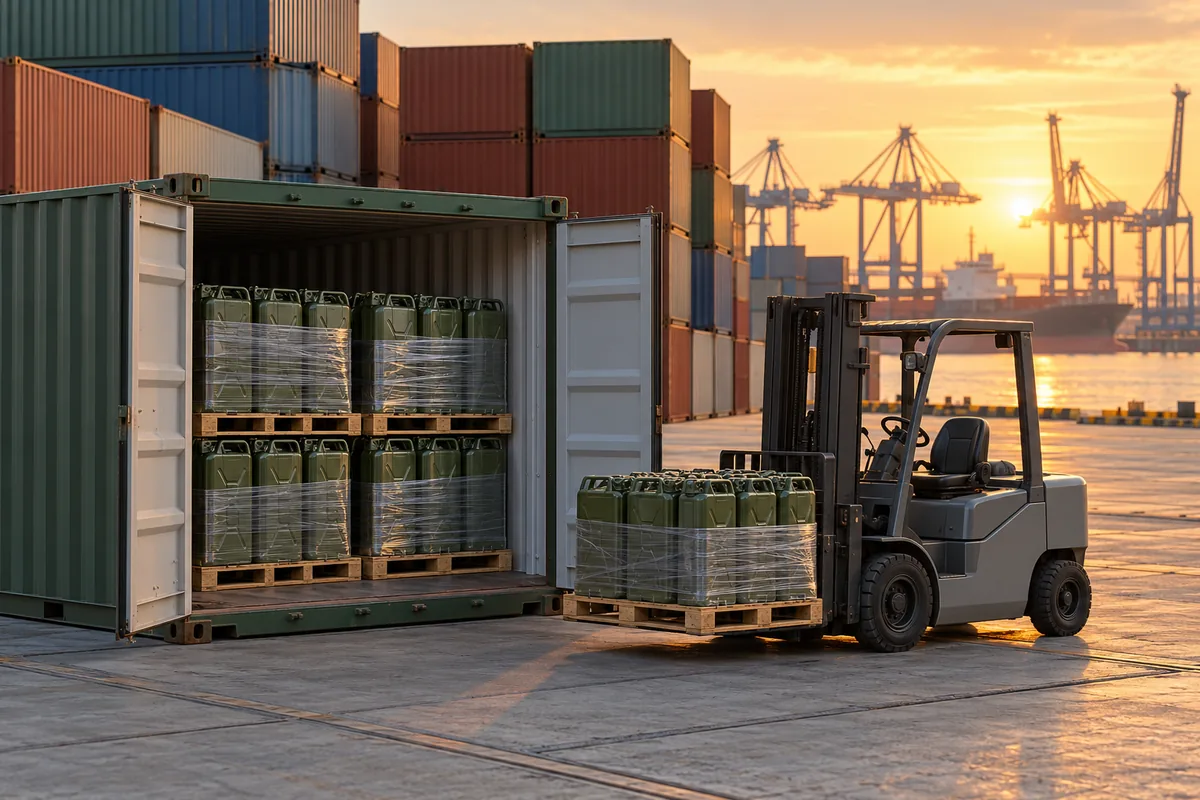
No official statistic measures the jerry can market on its own. The nearest is HS 7310.29, steel cans and containers under 50 litres. In 2024 the 127 countries that reported exported US$2.56 billion of it: China 18.6%, Italy 11.1%, Germany 10.6% and the United States 9.6% (UN Comtrade, pulled 21 October 2026). The code holds far more than jerry cans, so read it as a ceiling.
Quick answer: Which country exports the most jerry cans?
China, on the nearest official measure. No customs code covers jerry cans alone; steel ones enter under HS 7310.29, steel containers under 50 litres. In 2024 China shipped 18.6% of world exports of that code, ahead of Italy at 11.1%, Germany at 10.6% and the United States at 9.6% (UN Comtrade). Trade data record exports, not production.
Work it out
No official body publishes a jerry can market size, because no customs code covers jerry cans and nothing else. Customs authorities count goods by code. The code a steel jerry can enters under, HS 7310.29, also takes every other steel tank, cask, drum, can and box under 50 litres that is not closed by soldering or crimping. Its trade figures set an upper bound on the steel jerry can trade and cannot measure it.
Trade data also leave out cans made and sold inside one country, and they count value and kilograms, never units. A market size quoted as a single number, with no code, year or source behind it, is an estimate you cannot check against these tables.
The plastic jerry can market is harder still to size. US Customs and Border Protection ruled in HQ 954863 (14 July 1994) that high-density polyethylene jerry cans of up to 25 litres fall in subheading 3923.30, “carboys, bottles, flasks and similar articles” of plastics. World exports under 3923.30 came to US$11.72 billion in 2024, and the code gives no way to separate jerry cans from the bottles and flasks around them. A US ruling decides US entries; other customs authorities classify for themselves.
A steel jerry can under 50 litres is HS 7310.29, and a plastic one is 3923.30 under the US ruling above. Heading 7310 covers tanks, casks, drums, cans, boxes and similar containers of iron or steel up to 300 litres, for any material other than compressed or liquefied gas (UK Trade Tariff, heading 7310). At six digits it splits by capacity and closure.
| Code | What it covers | Typical goods | World exports 2024 (US$ m) |
|---|---|---|---|
| 7310.10 | Steel containers of 50 to 300 litres | 205 litre and 55 gallon drums | 2,060.5 |
| 7310.21 | Under 50 litres, cans to be closed by soldering or crimping | Food and drink cans | 2,840.6 |
| 7310.29 | Under 50 litres, other | Steel jerry cans | 2,557.0 |
| 3923.30 | Plastic carboys, bottles, flasks and similar articles | Plastic jerry cans (US ruling HQ 954863) | 11,718.9 |
In the UK Trade Tariff, steel containers above 300 litres move to heading 7309, gas cylinders to 7311 and aluminium cans to 7612. Every can on our jerry can sizes chart, from 3 to 30 litres, sits under the 50 litre line. Past six digits the codes diverge: the EU Combined Nomenclature and the UK tariff both split 7310.29 at a wall thickness of 0.5 mm. Our commodity codes and origin guide covers how to settle a code and get a binding ruling, and CBAM and steel containers covers the carbon reporting that heading 7310 brings into the EU.
China is the largest exporter of HS 7310.29, with US$474.9 million in 2024, 18.6% of world exports. Italy, Germany and the United States follow, and the four together shipped 49.9% of the total. The top ten account for 70.4%.
| Rank | Exporter | Exports 2024 (US$ m) | Share of world exports |
|---|---|---|---|
| 1 | China | 474.9 | 18.6% |
| 2 | Italy | 284.4 | 11.1% |
| 3 | Germany | 270.2 | 10.6% |
| 4 | United States | 246.0 | 9.6% |
| 5 | Republic of Korea | 106.2 | 4.2% |
| 6 | Portugal | 91.2 | 3.6% |
| 7 | Netherlands | 90.0 | 3.5% |
| 8 | Mexico | 89.7 | 3.5% |
| 9 | United Kingdom | 83.7 | 3.3% |
| 10 | Poland | 62.5 | 2.4% |
| World, 127 reporters | 2,557.0 | 100% |
Six of the ten are European. EU member states report trade with each other as exports and imports, which lifts them in any table of countries. Viet Nam is absent because it has not reported 2024 data to UN Comtrade; its partners’ records, covered in the method section below, would place it about 26th. The United Kingdom ranks ninth as an exporter and third as an importer.
The United States imported the most HS 7310.29 in 2024: US$217.6 million, 8.9% of world imports, ahead of France and the United Kingdom. Buying is spread wider than selling. The top ten importers took 54.5% of world imports, against 70.4% of exports for the top ten exporters.
| Rank | Importer | Imports 2024 (US$ m) | Share of world imports |
|---|---|---|---|
| 1 | United States | 217.6 | 8.9% |
| 2 | France | 200.5 | 8.2% |
| 3 | United Kingdom | 184.8 | 7.5% |
| 4 | Germany | 131.2 | 5.3% |
| 5 | Canada | 122.8 | 5.0% |
| 6 | Republic of Korea | 122.1 | 5.0% |
| 7 | Mexico | 112.9 | 4.6% |
| 8 | Netherlands | 96.3 | 3.9% |
| 9 | Spain | 86.6 | 3.5% |
| 10 | Poland | 64.4 | 2.6% |
| World, 148 reporters | 2,457.4 | 100% |
World imports, at US$2.46 billion from 148 reporters, come out lower than world exports. The two sums cover different sets of countries and value goods at different borders, as the method section explains. EU members appear one by one in this table, with their trade with each other included; the six-market table further down counts the EU as one buyer, from outside the bloc.
Steel drums of 50 to 300 litres trade under HS 7310.10, worth US$2.06 billion in world exports in 2024. The United States leads exports with US$297.9 million, 14.5% of the total, and Mexico leads imports with US$147.9 million, 9.0%.
| Rank | Exporter | US$ m (share) | Importer | US$ m (share) |
|---|---|---|---|---|
| 1 | United States | 297.9 (14.5%) | Mexico | 147.9 (9.0%) |
| 2 | Mexico | 171.9 (8.3%) | Germany | 131.3 (8.0%) |
| 3 | Germany | 146.0 (7.1%) | United States | 124.8 (7.6%) |
| 4 | Italy | 139.9 (6.8%) | Republic of Korea | 86.8 (5.3%) |
| 5 | Poland | 134.1 (6.5%) | France | 77.7 (4.7%) |
| World | 2,060.5 (120 reporters) | World | 1,636.1 (148 reporters) |
The code takes the 205 litre and 55 gallon drum, covered in our drum guide, along with every other steel container from 50 to 300 litres. Mexico, the United States and Germany sit in the top three of both lists. Drums ship by the container load, and container loading for drums, IBCs and jerry cans gives the count per 20ft and 40ft box.
World exports of HS 7310.29 rose 30.2% from US$2.22 billion in 2020 to a peak of US$2.90 billion in 2022, then fell 11.7% to US$2.56 billion in 2024, which leaves the trade 15.0% above 2020. China’s exports moved between US$474.9 million and US$626.0 million, and its share slipped from 21.4% to 18.6%.
| Year | World exports (US$ m) | Countries reporting | China (US$ m) | China’s share |
|---|---|---|---|---|
| 2020 | 2,223.3 | 141 | 475.8 | 21.4% |
| 2021 | 2,571.4 | 148 | 535.1 | 20.8% |
| 2022 | 2,895.0 | 145 | 626.0 | 21.6% |
| 2023 | 2,686.0 | 146 | 479.7 | 17.9% |
| 2024 | 2,557.0 | 127 | 474.9 | 18.6% |
| 2025, provisional | 2,666.5 | 107 | 464.6 | Not comparable |
The series is in current US dollars, converted by UN Comtrade from national currencies at IMF monthly average rates, so exchange rates move it as well as volumes. Fewer countries reported 2024 than 2023: the 23 reporters of 2023 with no 2024 return, led by the United Arab Emirates and Viet Nam, had shipped 0.9% of 2023 exports. The 2025 row is incomplete, with 107 exporters reported by 21 October 2026, so it stays out of the comparison.
China is the first source of HS 7310.29 imports for all six markets. Its share runs from 69.2% of Australia’s imports to 25.1% of the United States’, where Mexico supplies almost as much.
| Market | Imports 2024 (US$ m) | First source | Second | Third |
|---|---|---|---|---|
| United Kingdom | 184.8 | China 28.8% | Italy 15.4% | Germany 12.3% |
| European Union, from outside the EU | 276.7 | China 37.7% | United Kingdom 17.4% | Switzerland 8.9% |
| Australia | 29.1 | China 69.2% | Malaysia 4.8% | Other Asia, n.e.s. 4.1% |
| New Zealand | 7.5 | China 55.9% | Australia 19.8% | Malaysia 4.1% |
| Japan | 53.0 | China 61.8% | United States 13.5% | Switzerland 6.7% |
| United States | 217.6 | China 25.1% | Mexico 21.3% | Italy 13.5% |
Each figure is the importer’s own record, by country of origin. New Zealand also recorded 8.4% of its imports as its own goods returning. European buyers lean on European makers: the UK takes 39.9% of its steel cans from Italy, Germany and Portugal, and the EU’s second source after China is the UK.
Eurostat’s eight-digit data narrow the EU figure. Of the €255.5 million the EU imported from outside the bloc in 2024, €161.3 million, 63.1%, came in containers with walls of 0.5 mm or more (CN 7310 29 90). That is the line our pressed steel jerry cans fall in, with walls of 0.5 to 0.9 mm (see steel for cans and drums), and China supplied 26.7% of it. Thinner containers under CN 7310 29 10 came 56.4% from China.
About US$4.3 per kilogram in 2024, averaged across everything in HS 7310.29. The 119 exporters that gave a net weight shipped US$2,390.6 million over 559.9 million kg, US$4.27 per kg. On the import side, 131 countries recorded US$1,741.7 million over 412.3 million kg, US$4.22 per kg.
| Flow, 2024 | Value (US$ m) | Net weight (tonnes) | US$ per kg | Weight estimated by UN Comtrade |
|---|---|---|---|---|
| Exports, 119 reporters | 2,390.6 | 559,874 | 4.27 | 66% |
| Imports, 131 reporters | 1,741.7 | 412,294 | 4.22 | 69% |
This is an average over every tank, cask, drum, can and box in the code, at border values, and it does not price any product. UN Comtrade standardises the weights countries report and estimates them where needed, and two-thirds of the weight behind these averages is its own estimate. Use the figure to compare the same code across years or between datasets.
Every US dollar figure comes from the UN Comtrade database, queried through its public API on 21 October 2026: annual data, HS as reported, totals across customs procedures and transport modes. World totals are the sum of every reporting country, with the EU and ASEAN group rows left out so nothing counts twice, and each share is a share of that sum. The EU detail at eight digits comes from Eurostat Comext, dataset DS-045409, which publishes in euros. The World Bank’s WITS service returns the same China export total, US$474.93 million.
Partner “World” means a country’s trade with all partners combined. UN Comtrade defines total exports as domestic exports plus re-exports, so re-exports sit inside every export figure; the United States reported US$20.9 million of re-exports within its 2024 total. Imports include re-imports in the same way. Exporters value goods free on board at their own border, and most countries value imports with cost, insurance and freight added (IMTS 2010, para. 4.7), so world imports and world exports do not match.
A country’s exports rarely equal what its partners record as imports from it. Importers record the country of origin and exporters the country of last known destination (IMTS 2010, para. 6.25). Goods also pass through third countries, wait in customs warehouses and get classified differently at each end. Partners recorded US$542.0 million of imports from China in 2024, against China’s own US$474.9 million of exports. These partner records, called mirror data, fill gaps: Viet Nam last reported in 2023, recording US$4.4 million of exports while its partners recorded US$13.1 million of imports from it, and for 2024 its partners recorded US$15.7 million.
A national office can also suppress a figure to protect an individual trader. The UN recommends reporting a suppressed figure at the next higher level of commodity or partner detail (IMTS 2010, para. 10.3), so a six-digit total can understate a country’s trade.
We are a Singapore company with production in Viet Nam and China, so our cans sit in two different rows of these tables. China is the largest exporter of HS 7310.29 and the first source for all six markets above. Viet Nam’s steel can exports are small in the data, about 0.6% of world exports on its partners’ records, and its own 2024 return is missing. Importers record our cans under the country that made them, Viet Nam or China, whatever address the invoice carries.
The country of production also sets the CBAM default value an EU importer uses, which our CBAM guide puts at about 4.7 tonnes of CO₂e per tonne of cans from China and 2.6 from Viet Nam in 2026. Buyers also ask for it under the EU forced labour regulation. Our second sourcing guide covers what to ask before you treat two origins as one source. The steel cans below enter under heading 7310; the commodity codes guide explains how to confirm the subheading for each.
| Your use case | Recommended can | Why this one |
|---|---|---|
| Steel jerry can, HS 7310.29 | 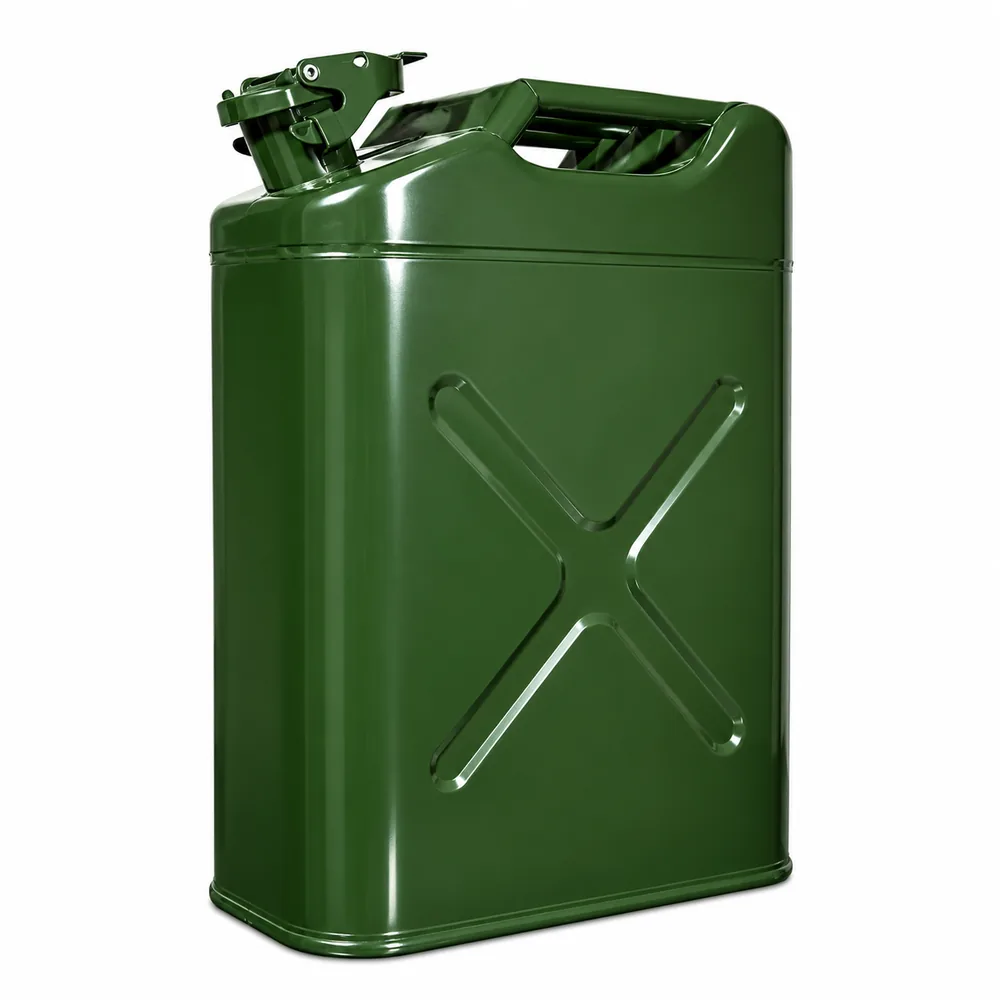 20L NATO Steel Fuel Can |
The 20 L NATO-pattern fuel can, UN-marked for dangerous goods, with its empty weight published for CBAM arithmetic. |
| Stainless water can | 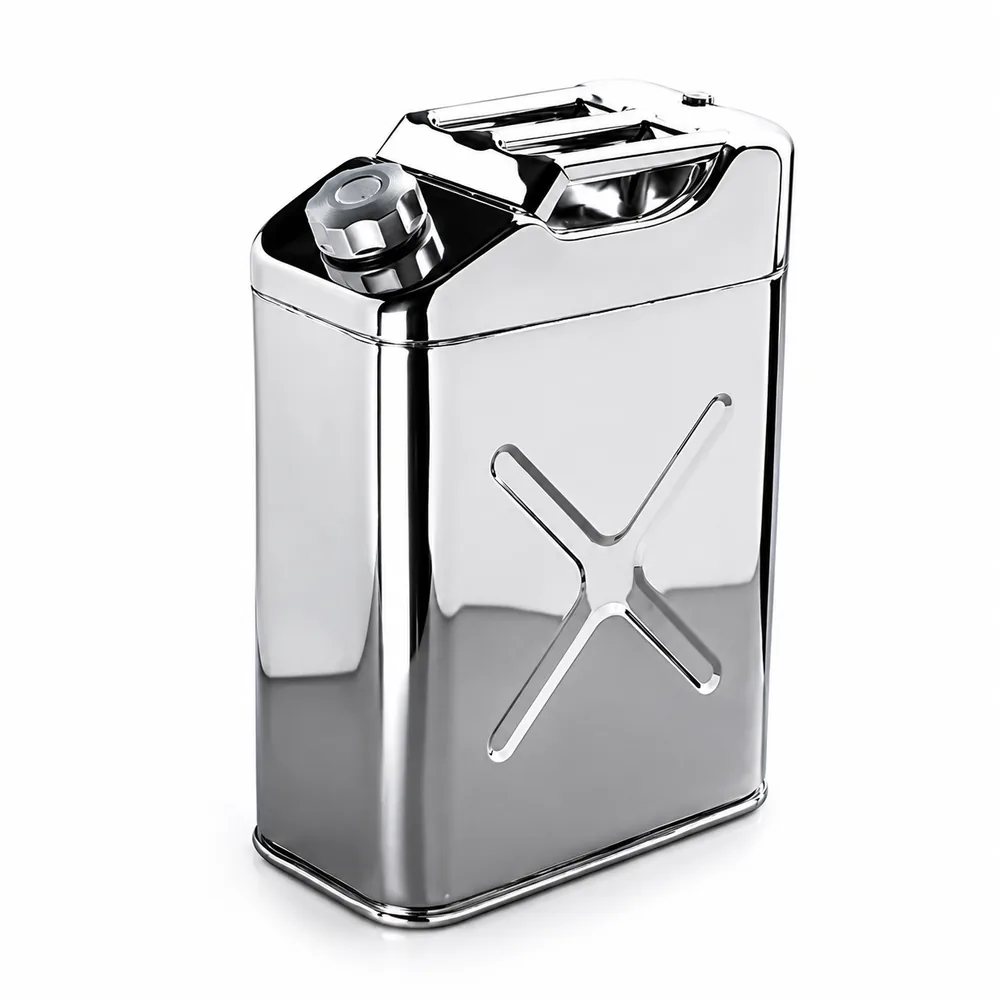 20L Stainless Steel Water Can |
AISI 304 stainless, which the tariff counts as steel, so it enters under heading 7310 like the carbon steel range. |
| Low-profile steel can | 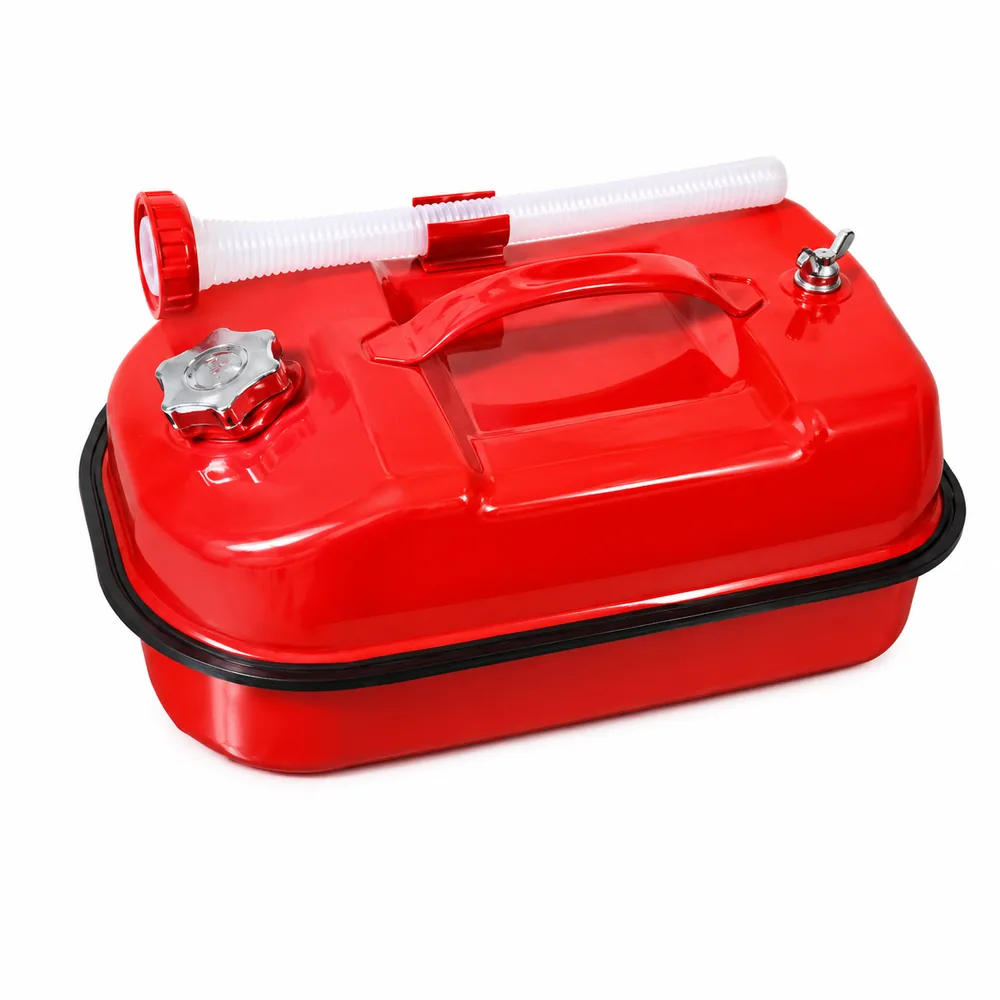 Horizontal Galvanised Can — 5L / 10L / 20L |
Galvanised steel in 5, 10 and 20 L, every size under the 50 litre line in heading 7310. |
| Open-head steel pail | 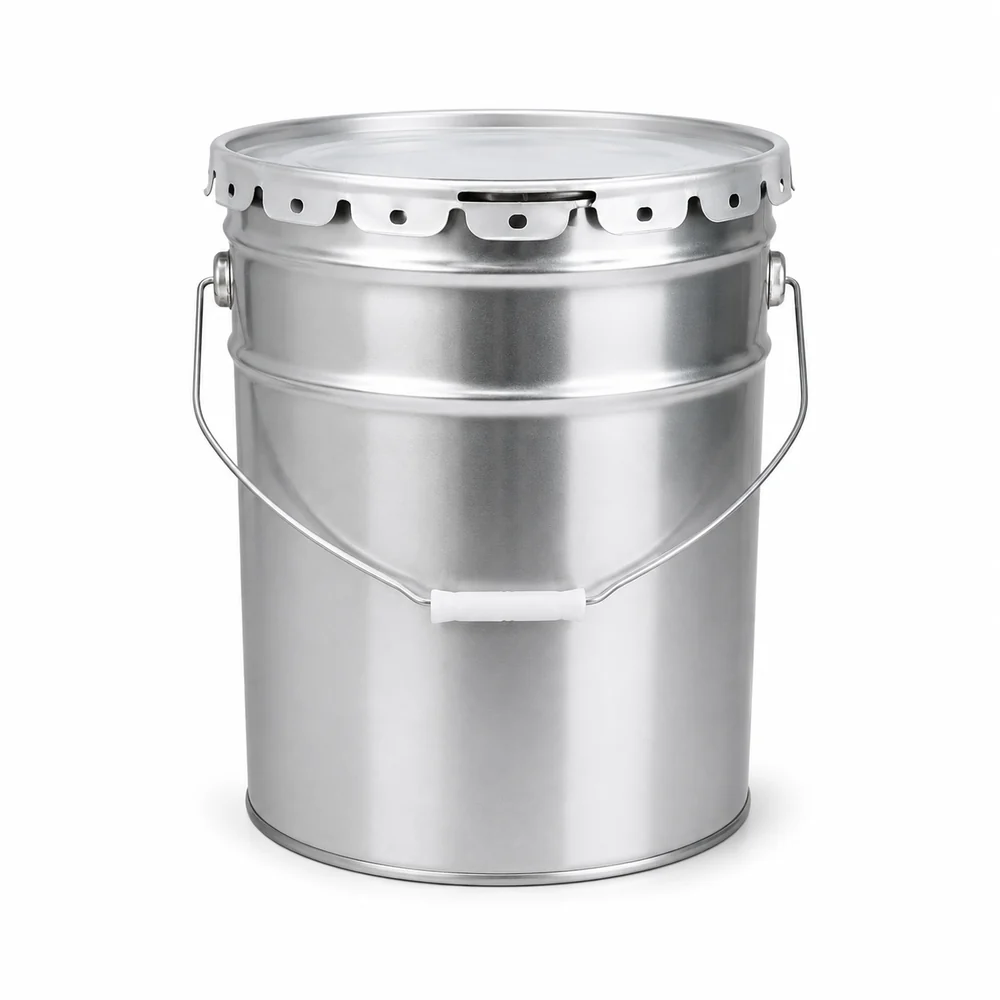 Metal Pail with Flower Lid or Lever Ring, 4L to 35L |
Tinplate steel pails from 4 to 35 L with a flower lid or lever ring; confirm the subheading for your closure. |
Every figure on this page is in one CSV file: jerry-can-trade-statistics.csv, with the source table and the date each figure was pulled.
No official source ranks makers, because trade data record exports and not production. China exports the most steel containers under 50 litres: US$474.9 million of HS 7310.29 in 2024, 18.6% of world exports, followed by Italy, Germany and the United States. Cans made and sold inside one country never cross a border, so they are missing from every figure on this page.
Yes, in small amounts on the official figures. Viet Nam last reported its trade to UN Comtrade for 2023, when it recorded US$4.4 million of HS 7310.29 exports. Its partners recorded US$15.7 million of imports from Viet Nam in 2024, about 0.6% of world exports. The flow also runs the other way: China recorded US$28.3 million of exports under the same code to Viet Nam that year.
No official source counts them. Trade statistics record value and net weight, and the code that holds steel jerry cans holds every other steel container under 50 litres that is not soldered or crimped shut. In 2024 the exporters that gave a weight shipped 559.9 million kg under HS 7310.29, two-thirds of it estimated by UN Comtrade, and that total cannot be split into cans of one type.
Yes, on the heading text. Heading 7310 covers containers of iron or steel, and note 1(e) to Chapter 72 defines stainless steel as an alloy steel with at least 10.5% chromium, so a stainless can under 50 litres falls in 7310.29. The UK tariff splits off refillable stainless kegs and drums of 4.5 litres or more at ten digits (7310 29 90 10), and that line excludes cans and boxes.
Heading 7612, which covers aluminium casks, drums, cans, boxes and similar containers of up to 300 litres. An aluminium can therefore sits outside every steel figure on this page. Heading 7612 is on the EU CBAM list as well, so moving from steel to aluminium does not take a container out of carbon reporting in the EU.
For a steel jerry can with a wall of 0.5 mm or more, 7310 29 90 in the EU Combined Nomenclature; thinner walls go to 7310 29 10. The UK tariff uses the same split and adds ten-digit lines, with an ordinary can under 7310 29 90 90. The importer answers for the code it declares, and a binding tariff ruling is how to settle it in advance.
In the UN Comtrade database at comtradeplus.un.org: choose goods, annual frequency, HS code 731029, a reporting country and partner World. The World Bank’s WITS site shows the same data by partner, and Eurostat Comext gives EU trade at eight digits, in euros. Recent years fill in as countries report, so note the date you pulled each figure.
They were incomplete on 21 October 2026, when we pulled the data. For HS 7310.29, 107 countries had reported 2025 exports against 127 for 2024, and the 25 still missing had shipped 1.8% of 2024 world exports between them. The provisional 2025 sum, US$2.67 billion, appears in the trend table for reference and should not be compared with complete years.
Not elsewhere specified. In a commodity description it marks the residual line of a heading: HS 7310.29 takes the steel containers under 50 litres that no other subheading names, and Eurostat labels it n.e.s. for that reason. UN Comtrade also uses “Other Asia, n.e.s.” as the name of one reporting and partner area, and the tables on this page keep its wording.
As a mid-sized trader. Singapore reported US$22.8 million of HS 7310.29 exports and US$24.9 million of imports in 2024, 24th and 23rd in the world, and its exports include re-exports. Cans that a Singapore company has made in Viet Nam or China and ships from the factory count as Vietnamese or Chinese exports, and importers record them under that origin.
The standards and regulations this page relies on, at their issuing body. Where a market rule is named here, check the current revision before you specify against it.
Last reviewed by David Guru, Co-Founder & Business Development Director.
Tell us the destination market, the products and your volumes. We come back with a specification sheet, the tariff code and a quotation.